Source Code: https://github.com/tim-fitzgerald/okta-workflows-metrics
Okta Workflows has some “OKAY” ways to handle errors if you know where to expect them. You can add exception handling on a per-card basis but doing this for every card in a flow is cumbersome, so generally we focus on the cards that are most likely to fail but this leaves a gap when another card fails unexpectedly. Alternatively you can wrap the entire flow in an “If Error” card, but that really hampers readability of the flow. What I want is just a general alerting system for all unhandled errors in a flow - and ideally a way to visualise error rates over time. Datadog is the tool I default to for this kind of alerting so I wanted to figure out how to get Okta Workflows talking to that platform.
Serendipitously, around the same time I was thinking about this Okta introduced Execution Log Streaming as an EA feature. Despite the word “Streaming” in the feature title, this is just a webhook that fires for any event that you subscribe to (e.g. flow start, flow complete, flow fail). I just needed to write some kind of middleware to parse the events and send them to Datadog. I chose to write this in Ruby and to have it serviced in AWS by API Gateway and Lambda - this also gave me an opportunity to play around with aws-sam-cli which promised to make deploying and updating my script very straightforward.
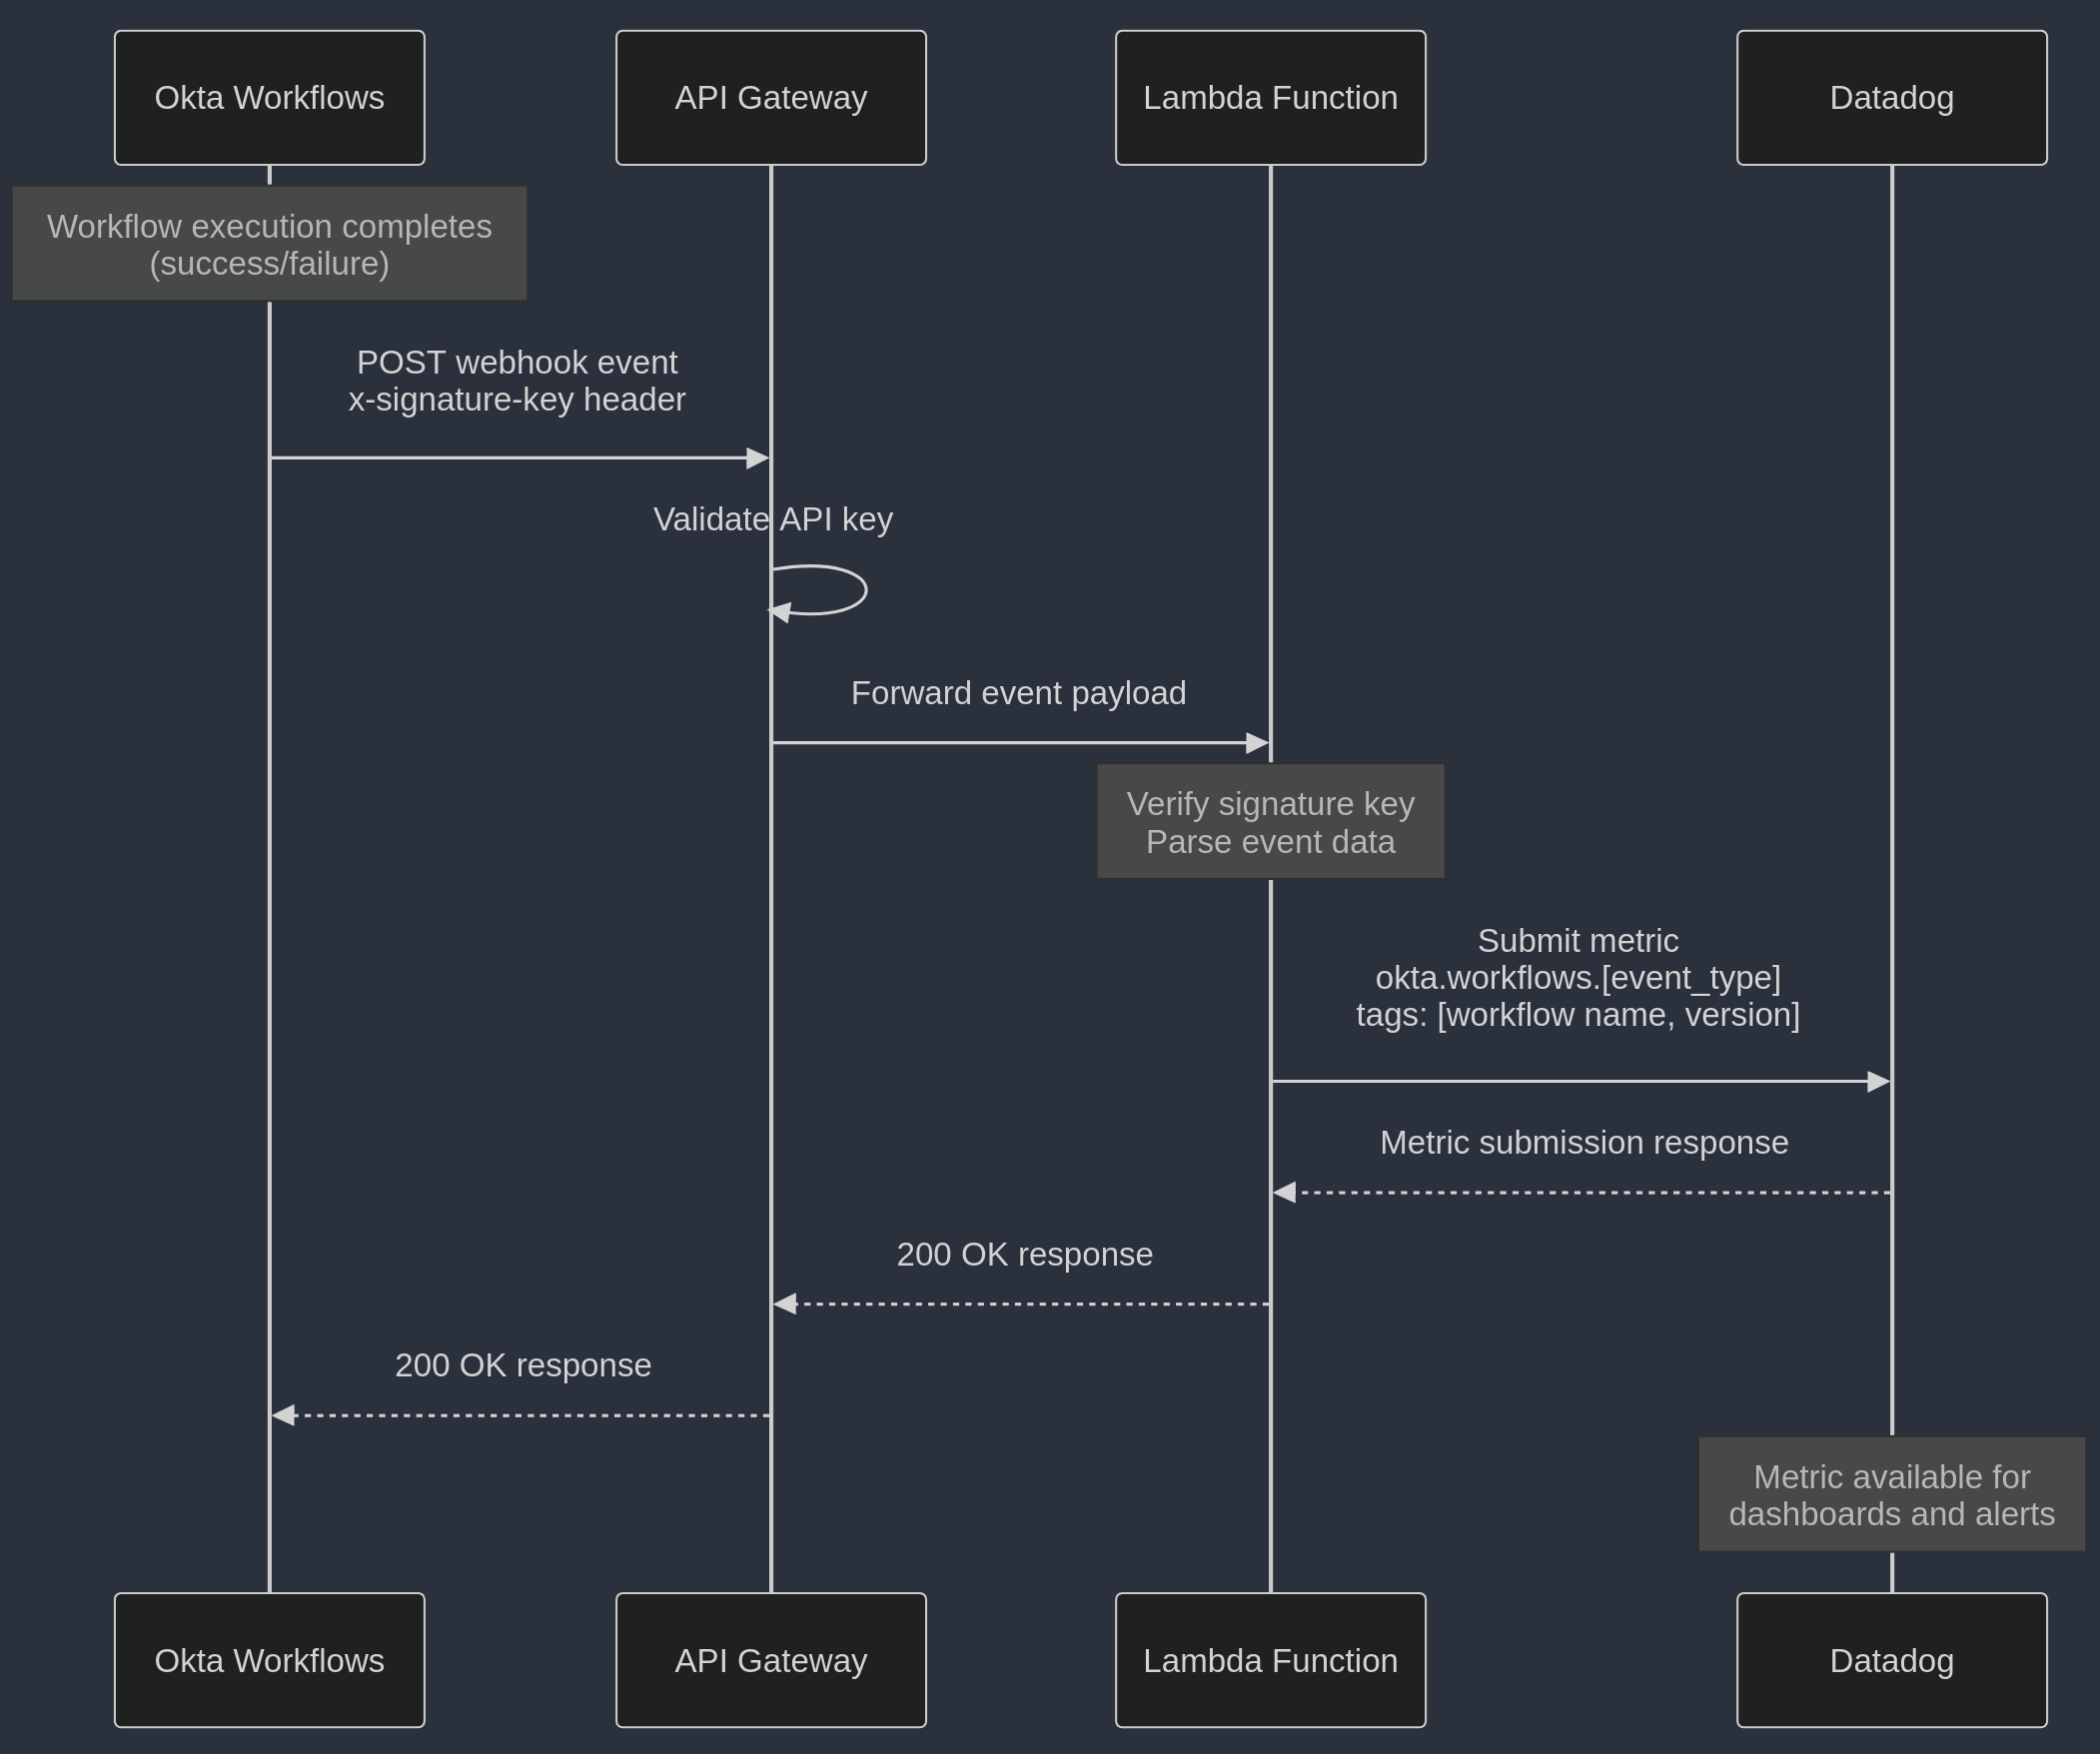
This post assumes you have some familiarity with Ruby, AWS Lambda, and Cloudformation - it is not intended to be a tutorial in any of these rather just a “this is how I did it” post. All in all, this only took a day or so to build and deploy. Below is a simple diagram demonstrating the flow of data in this implementation.

Project Structure
Before we dive into the code, let’s look at how our project is organised. This structure follows AWS SAM conventions while accommodating our Ruby Lambda function:
okta-workflow-metrics/
├── Gemfile                 # Project-level dependencies
├── README.md
├── events/
│   └── flow_complete.json  # Sample event for local testing
├── okta-workflow-metrics-function/
│   ├── Gemfile            # Lambda function dependencies
│   └── app.rb             # Our Lambda function code
└── template.yaml          # SAM template for AWS resources
The key files serve the following purposes:
events/flow_complete.json: Contains a sample Okta Workflows event payload we can use for local testing.okta-workflow-metrics-function/: Houses our Lambda function code and its dependencies.template.yaml: Defines our AWS resources including the Lambda function and API Gateway.
Note that we have two Gemfiles:
- The root
Gemfileis for local development and testing. - The one in
okta-workflow-metrics-function/defines the gems that will be packaged with our Lambda function.
The Middleware Script
This is the meat and potatoes of the whole thing. This is the Ruby Lambda code that receives an event from the API Gateway, interprets and parses that event, and then sends the relevant metric to Datadog. Overall, it’s quite simple but we will break it down piece by piece.
Main Handler Function
This is our entry point that AWS Lambda calls when it receives an event:
# frozen_string_literal: true

$LOAD_PATH.unshift("/var/task/vendor/cache")
require "json"
require "datadog_api_client"

def lambda_handler(event:, context:)
  begin
    check_origin_signature_key(event["headers"]["x-signature-key"])

    event = JSON.parse(event["body"])

    metric_name = parse_event_type(event)
    workflow_name = event["flow_name"]

    message = datadog_submit_metric(metric_name, workflow_name)
    body = JSON.generate({ message: message.to_s })

    { statusCode: 200, body: body }
  rescue StandardError => e
    # Log the error for debugging
    puts "Error processing event: #{e.message}"
    puts e.backtrace.join("\n")

    # Return an error response
    { statusCode: 500, body: JSON.generate({ message: "Error processing event: #{e.message}" }) }
  end
end
The handler performs these key steps:
- Validates the incoming request using a signature key
- Parses the JSON body of the event
- Extracts the event type and workflow name
- Submits the metric to Datadog
- Returns an appropriate HTTP response
Security Validation
We verify that the request is coming from our Okta Workflows instance by checking the signature key:
def check_origin_signature_key(signature_key)
  if signature_key != ENV.fetch("SIGNATURE_KEY", nil)
    return { statusCode: 401, body: "Unauthorized: Origin signature key does not match." }
  end
end
This signature key should match what you’ve configured in your Okta Workflows log streaming settings. Using ENV.fetch instead of ENV[] ensures we fail fast if the environment variable isn’t set.
Datadog Client Configuration
We initialise the Datadog client with our API key:
def datadog_client
  DatadogAPIClient.configure do |config|
    config.api_key = ENV.fetch("DATADOG_API_KEY", nil)
  end
  DatadogAPIClient::V2::MetricsAPI.new
end
This assumes you have set a Datadog API key in the Lambda environment variables.
Metric Construction
We construct the metric payload:
def datadog_metric_body(metric_name, workflow_name)
  DatadogAPIClient::V2::MetricPayload.new({
    series: [
      {
        metric: metric_name,
        type: DatadogAPIClient::V2::MetricIntakeType::GAUGE,
        points: [
          DatadogAPIClient::V2::MetricPoint.new({
            timestamp: Time.now.to_i,
            value: 1,
          }),
        ],
        tags: [
          "workflow:#{workflow_name}",
          "version:1.0",
        ],
      },
    ],
  })
end
Key points about the metric:
- We use a GAUGE type as we’re recording point-in-time events
- Each event has a value of 1, allowing us to count occurrences
- We tag with the workflow name for filtering in Datadog
Metric Submission
Here’s where we actually send the metric to Datadog:
def datadog_submit_metric(metric_name, workflow_name)
  puts "Submitting metric to Datadog: #{metric_name}"
  body = datadog_metric_body(metric_name, workflow_name)
  datadog_client.submit_metrics(body)
end
Event Type Parsing
Finally, we format the event type into a Datadog-friendly metric name:
def parse_event_type(event)
  "okta.workflows.#{event["event_type"].downcase}"
end
This creates metrics like:
okta.workflows.flow.errorokta.workflows.flow.completed
This naming convention follows my preferred best practices, and makes it easy to locate the metrics in the explorer. But, they are arbitrary and you could rename it as needed for your environment.
Testing and Deployment
I basically followed this guide on developing AWS Lambda functions locally for testing locally and eventually deploying - so I won’t recap everything covered there. The major difference between that guide and my deployment is that I also needed to include an API Gateway service to receive the events from Okta.
In the end my template.yaml file looked as follows:
AWSTemplateFormatVersion: '2010-09-09'
Transform: AWS::Serverless-2016-10-31
Description: >
  okta-workflow-metrics

Globals:
  Function:
    Timeout: 3
    MemorySize: 512

Resources:
  OktaWorkflowMetricsFunction:
    Type: AWS::Serverless::Function
    Properties:
      CodeUri: okta-workflow-metrics-function/
      Handler: app.lambda_handler
      Runtime: ruby3.3
      Architectures:
        - x86_64
      Events:
        OktaWorkflowMetrics:
          Type: Api
          Properties:
            Auth:
              ApiKeyRequired: true
            Path: /<api-endpoint-path>
            Method: post

Outputs:
  OktaWorkflowMetricsApi:
    Description: "API Gateway endpoint URL for Prod stage for Okta Workflow Logs function"
    Value: !Sub "https://${ServerlessRestApi}.execute-api.${AWS::Region}.amazonaws.com/Prod/<api-endpoint-path>"
  OktaWorkflowMetricsFunction:
    Description: "Okta Workflow Logs Lambda Function ARN"
    Value: !GetAtt OktaWorkflowMetricsFunction.Arn
  OktaWorkflowMetricsFunctionIamRole:
    Description: "Implicit IAM Role created for OktaWorkflowMetrics function"
    Value: !GetAtt OktaWorkflowMetricsFunctionRole.Arn
In our template we are defining Api as our event source for the function. We are requiring an API key for authentication, and then specifying the URL path and HTTP method for the endpoint.
We can now build our function using sam build, and deploy with sam deploy --guided.
After deployment, I also needed to create an API Key and attach it to a Usage Plan in AWS. The usage plan concept kind of assumes this will be a consumer facing service with usage limits etc., but it doesn’t have any actual impact on this project other than to facilitate there being an API key for authentication.
Datadog

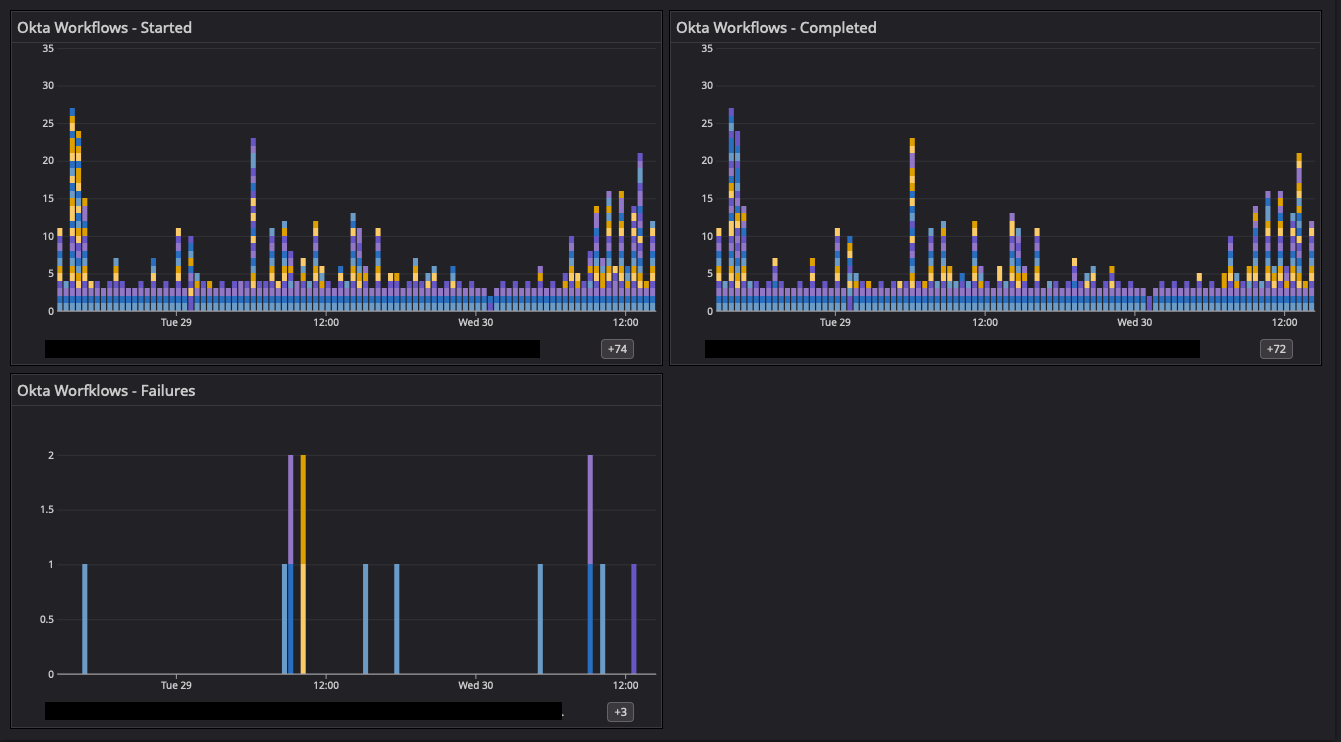
Look at all the pretty colours.
Once we have the Lambda function deployed we can start building useful graphs and dashboards in Datadog to help us understand where we are seeing failures. I’ve obscured some detail in this screenshot, but hovering over any of these metric events will display the name of the Okta Workflow responsible for that metric. And with that - now we have a means to monitor unhanded errors!
